PCA appendix.
The dimension weights used in the Civica Index are derived from the data, not asserted. This page documents the principal component analysis that produced them, with full disclosure of methodology, sample size, and limitations.
Section 1Headline finding
The 4 governance dimensions of the Civica Index are highly correlated (range 0.74 to 0.98). Principal component analysis confirms a single dominant latent factor: PC1 explains 90.7% of the variance in the panel, and all 4 dimensions load on it with similar magnitude (0.479 to 0.516). Components 2 through 4 each have eigenvalues well below the Kaiser threshold of 1.0, meaning the data does not support breaking the governance core into multiple distinct factors.
The 4-dimension breakout is therefore best understood as a transparency device — it lets readers see how each facet contributes — rather than as a claim that the 4are statistically independent. The composite score is, in effect, a single “governance quality” index disaggregated into 4 interpretable sub-scores.
Weights are taken proportional to the squared PC1 loadings (a standard practice in composite-index construction):
| Dimension | Provisional | PCA-suggested | Adopted |
|---|---|---|---|
| Democratic quality | 0.30 | 0.266 | 0.27 |
| Rule of law | 0.25 | 0.257 | 0.26 |
| Freedoms & rights | 0.25 | 0.229 | 0.23 |
| Corruption control | 0.20 | 0.248 | 0.24 |
| Sum | 1.00 | 1.000 | 1.00 |
The biggest revision is corruption control (0.20 → 0.24, +20% relative). Democratic quality drops slightly (0.30 → 0.27). The other two are essentially unchanged. Because the indicators are so correlated, the impact on country rankings is small: the largest delta from the weight revision alone is under one point.
Section 2The panel
n = 46 countries with all 4 governance dimensions present. Data vintage: 2023 (the most recent year fully ingested into Civica). Source: ci_dimension_scores table, normalized via the Beta fixed-bound transforms documented in the main methodology.
The countries are not a random sample — they are the ingested set, weighted toward larger democracies and authoritarian states with active governance research coverage. Coverage is sparser in small island states and in microstates. This is a known limitation of the panel and does not change the conclusion that the 4 indicators are highly correlated, but it does mean the absolute magnitude of the loadings might shift slightly with a broader sample.
Section 3Correlation matrix
Pearson correlations between the 4 normalized dimensions:
| Demo. quality | Rule of law | Freedoms & rights | Corruption ctrl | |
|---|---|---|---|---|
| Democratic quality | 1.00 | 0.90 | 0.95 | 0.89 |
| Rule of law | 0.90 | 1.00 | 0.81 | 0.98 |
| Freedoms & rights | 0.95 | 0.81 | 1.00 | 0.74 |
| Corruption control | 0.89 | 0.98 | 0.74 | 1.00 |
Every off-diagonal correlation is above 0.74 — strong by any reasonable threshold. Rule of law and corruption control are nearly indistinguishable empirically (r = 0.98), which suggests the weight on those two could be partially redundant. The 5th-dimension test in §6 partially addresses this question; a fuller answer requires the ingestion of separate WGI Government Effectiveness data.
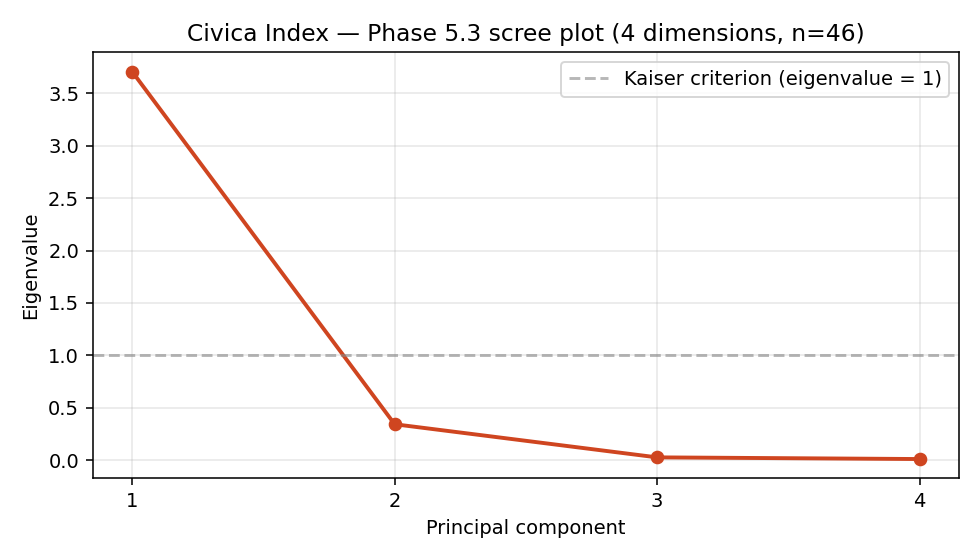
Section 4Eigenvalues & variance
PCA on the standardized panel (mean 0, variance 1 per dimension) yields these eigenvalues:
| Component | Eigenvalue | Var. explained | Cumulative |
|---|---|---|---|
| PC1 | 3.707 | 90.7% | 90.7% |
| PC2 | 0.343 | 8.4% | 99.1% |
| PC3 | 0.027 | 0.7% | 99.7% |
| PC4 | 0.011 | 0.3% | 100.0% |
The Kaiser criterion (retain components with eigenvalue > 1) selects only PC1. The scree plot makes the same point visually:
Section 5PC loadings
How much each dimension contributes to each principal component:
| Dimension | PC1 | PC2 | PC3 | PC4 |
|---|---|---|---|---|
| Democratic quality | 0.516 | 0.261 | -0.529 | 0.621 |
| Rule of law | 0.507 | -0.407 | 0.684 | 0.333 |
| Freedoms & rights | 0.479 | 0.698 | 0.280 | -0.452 |
| Corruption control | 0.498 | -0.528 | -0.417 | -0.547 |
On PC1 — the only component the data supports — the 4 loadings are tightly clustered (0.479 to 0.516, range 0.04). All 4dimensions contribute roughly equally to the single “governance quality” latent factor. PC2 through PC4 represent residual variance below the noise floor.
Squaring the PC1 loadings and normalizing them to sum to 1.00 gives the suggested weights in §1. Rounding to two decimal places (and adjusting one weight by 0.01 to make the rounded values sum exactly to 1.00) gives the adopted weights.
Section 6The 5th-dimension test
The methodology spec considers adding a fifth dimension —Administrative Capacity, drawn from World Bank WGI Government Effectiveness and Regulatory Quality — if and only if it emerges as empirically distinct from Rule of Law in factor analysis.
This phase does not test that question. The WGI Government Effectiveness indicator is not yet ingested into Civica. The high correlation between Rule of Law and Corruption Control (r = 0.98) hints that adding a related governance-quality indicator might simply load on the same factor as Rule of Law — but that’s a hypothesis, not a finding. The test is deferred to a follow-up phase (after the indicator is ingested), at which point this appendix will be re-run and, if warranted, the methodology updated.
Section 7Limitations
Sample size. The methodology spec envisions a panel of 2000–2024 country-years (thousands of observations). The current panel is 46 countries from a single year — statistically usable but underpowered. Final weights will be re-validated when the historical panel is ingested. The structural decision (4-dim core, near-equal weights) is unlikely to change because the underlying correlation structure of these indicators is well-documented in the governance-measurement literature, but the precise magnitudes might shift.
Single-year panel. A cross-sectional PCA captures shared variance at one moment in time. It does not test whether the same factor structure holds over decades. The historical panel will address this.
Source coverage. The 46 countries with all 4dimensions are skewed toward larger states and active governance-research targets. Microstates and small island states are under-represented. The PCA findings should be understood as describing “the kinds of countries we currently have data for.”
No source-substitution sensitivity test. The spec calls for swapping each primary source with its secondary (e.g., V-Dem Liberal Democracy → V-Dem Polyarchy) and confirming rank stability. This requires the secondary sources to be ingested in parallel. Deferred to the same follow-up.
Section 8Reproducing this analysis
The full Python pipeline that produced these numbers is checked into the repository at analysis/phase-5-3/run_pca.py. It pulls directly from the production database, applies the same fixed-bound normalization documented in the main methodology, runs PCA via scikit-learn, and writes:
eigenvalues.csv— the table in §4loadings_pca.csv— the table in §5correlations.csv— the matrix in §3scree_plot.png— the figure in §4results.json— machine-readable summary including the suggested weights
To re-run the analysis on updated data: cd analysis/phase-5-3 && uv run python run_pca.py. The Python environment is managed by uv and the lockfile is committed for reproducibility.
Cite this page
Cite this page
Civica. (2026). Civica Atlas Methodology — PCA appendix: PCA appendix. Civica Atlas. Retrieved May 7, 2026, from https://civicaatlas.org/civica-index/methodology/pca-appendix